Biostatistics for MS2 Students
Part 2: The Normal Distribution
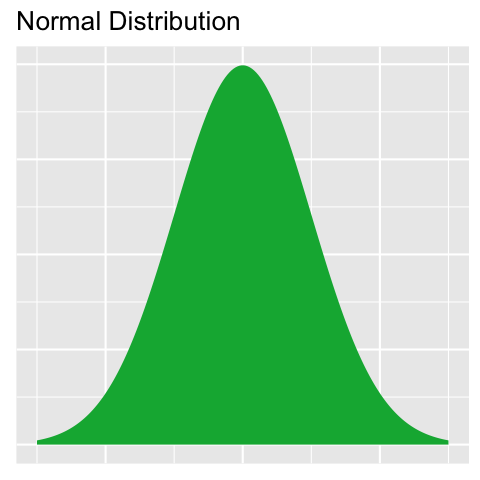
The Normal Distribution is a specific continuous statistical distribution, with several important properties. It was first studied in the 17th century because it had certain theoretical mathematical properties; in the late 19th and early 20th century is was shown that it also occurs widely in nature. This includes occurring frequently in measurements that are routinely taken in clinical and medical science.
The key properties of the normal distribution are:
- It is symmetric
- It is unimodal
- It has a characteristic "bell-shape"
The 68-95-99 rule
In particular, the normal distribution has the property that
- Approximately 68% of all values lie within 1 standard deviation of the mean
- Approximately 95% of all values lie within 2 standard deviations of the mean
- Approximately 99.7% of all values lie within 3 standard deviations of the mean

The standard normal distribution and Z-scores
If \(x\) is a variable sampled from a normal distribution with mean \(\mu\) and standard deviation \(\sigma\), then \(\frac{x-\mu}{\sigma}\) is distributed according to a normal distribution with mean 0 and standard deviation 1.
In other words, subtracting the mean from a normally distributed variable, and then dividing by the standard deviation standardizes the variable. We call the resulting quantity the Z-score for \(x\). The normal distribution with mean 0 and standard deviation 1 is sometimes called the standard normal distribution.
A consequence of this is that if \(x\) is from a normal distribution with mean \(\mu\) and standard deviation \(\sigma\), and \[Z=\frac{x-\mu}{\sigma}\] then
- 68% of the time, \(Z\) will lie between -1 and +1
- 95% of the time, \(Z\) will lie between -2 and +2
- 99.7% of the time, \(Z\) will lie between -3 and +3.
Did I understand this?
Assume for these questions that the BMI of males age 60-70 in the US is normally distributed with a mean of 29 and a standard deviation of 6.- What is the Z-score for the BMI of a man in this population with a BMI of 32?
- Z=1
- Z=0.5
- Z=0
- Z=-0.5
- Z=-1
IncorrectRemember, the Z-value is obtained by taking the raw value, subtracting the mean, and dividing the result by the standard deviation.Correct!The Z-value is obtained by taking the raw value, subtracting the mean, and dividing the result by the standard deviation. In this case, \[Z=\frac{32-29}{6}=\frac{3}{6}=0.5\] - Approximately what proportion of men in the US between the age of 60 and 70 have BMI over 35?
- 50%
- 32%
- 16%
- 5%
- 2.5%
IncorrectCompute how many standard deviations this is from the mean, and use the 68-95-99 rule.Correct!35 is 29+6, so it is one standard deviation above the mean.
By the 68-95-99 rule, 68% of men age 60-70 in the US have BMI within one standard deviation of the mean, i.e. between 23 and 35.
Because the normal distribution is symmetric, the remaining 32% are equally split between those with BMI above 35 and those with BMI below 23.
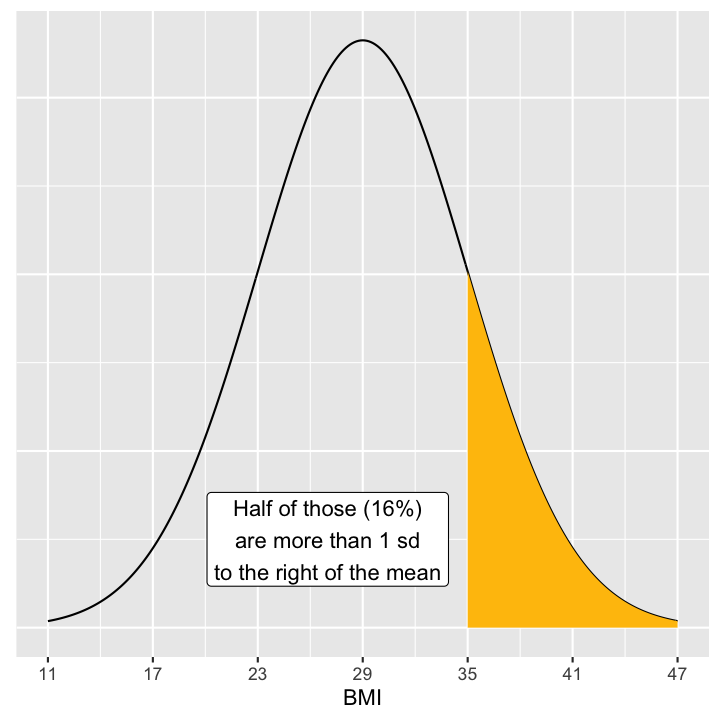
Consequently, half of those 32%, i.e. 16%, have BMI greater than 35.
Incorrect.You have fallen into a common trap with this kind of question. Some pictures will help. (It always helps to draw a picture for these questions.)The BMI of interest, 35, is 6 more than the mean, which is exactly 1 standard deviation more than the mean. The 68-95-99 rule tells us that 68% of all values lie within 1 standard deviation of the mean.
The remaining values, which account for 100%-68%=32%, lie outside this range.
However, these values include values which are more than 1 standard deviation less than the mean, as well as the values we're interested in: the values that are more than one standard deviation greater than the mean.
Because the distribution is symmetric, half of the values falling outside this range are to the right (greater than 35), and half are to the left (less than 23). So 16% of the BMI values for this population are greater than 35.

- Approximately what proportion of men in the US between the age of 60 and 70 have BMI below 17?
- 50%
- 32%
- 16%
- 5%
- 2.5%
IncorrectCompute how many standard deviations this is from the mean, and use the 68-95-99 rule.Correct!17 is 29-12, so it is two standard deviations below the mean.
By the 68-95-99 rule, 95% of men age 60-70 in the US have BMI within two standard deviations of the mean, i.e. between 17 and 41.
Because the normal distribution is symmetric, the remaining 5% are equally split between those with BMI above 41 and those with BMI below 17.
Consequently, half of those 5%, i.e. 2.5%, have BMI less than 17.