BMR 617: Statistical Techniques for the Biomedical Sciences
Installing R
Introduction: understanding what we'll install
R is a statistical computing environment. In it's most basic form, it runs as a command-line tool. This means you can open up a terminal (a text-only interface to your computer's operating system) and interact with R by typing commands and seeing the result. We'll actually do this, just once, to make sure R is installed properly.
While command-line tools are actually very powerful, they are not a very user-friendly way to use software. So as well as installing R, we'll also install a program called RStudio, which is an Integrated Development Environment (IDE). This provides a more user-friendly approach to using the underlying R environment. Note you'll still need to type commands and see the results, but we'll have a better environment to do that in
Installing R
- Navigate to https://www.r-project.org.
- Click on the download R link.
- This provides a list of mirror sites from which you can install R. It doesn't really matter which mirror you pick, but I usually choose the geographically closest one. Choose a mirror and click on the link.
- In the first box at the top, click on the "Download R for (your operating system)" link.
-
- For Mac users: click on the R
pkgfile for the latest version. - For Windows users: click on the "install R for the first time" link, and then click on the "Download R for windows" link for the current version.
- For Mac users: click on the R
- When your download is complete, open it. Click through the default options, which will install R.
Testing the R installation.
-
- For Mac users: Open R either by clicking on the R app icon
under
Applicationsin Finder, or by finding the R app in LaunchPad - For Windows users: Click on the start (windows) menu and find R under programs. There will be two versions: a 32-bit version and a 64-bit version. Choose the version appropriate for your operating system (which is almost certainly the 64-bit version, "x64").
- For Mac users: Open R either by clicking on the R app icon
under
-
You should see an application like one of the following:
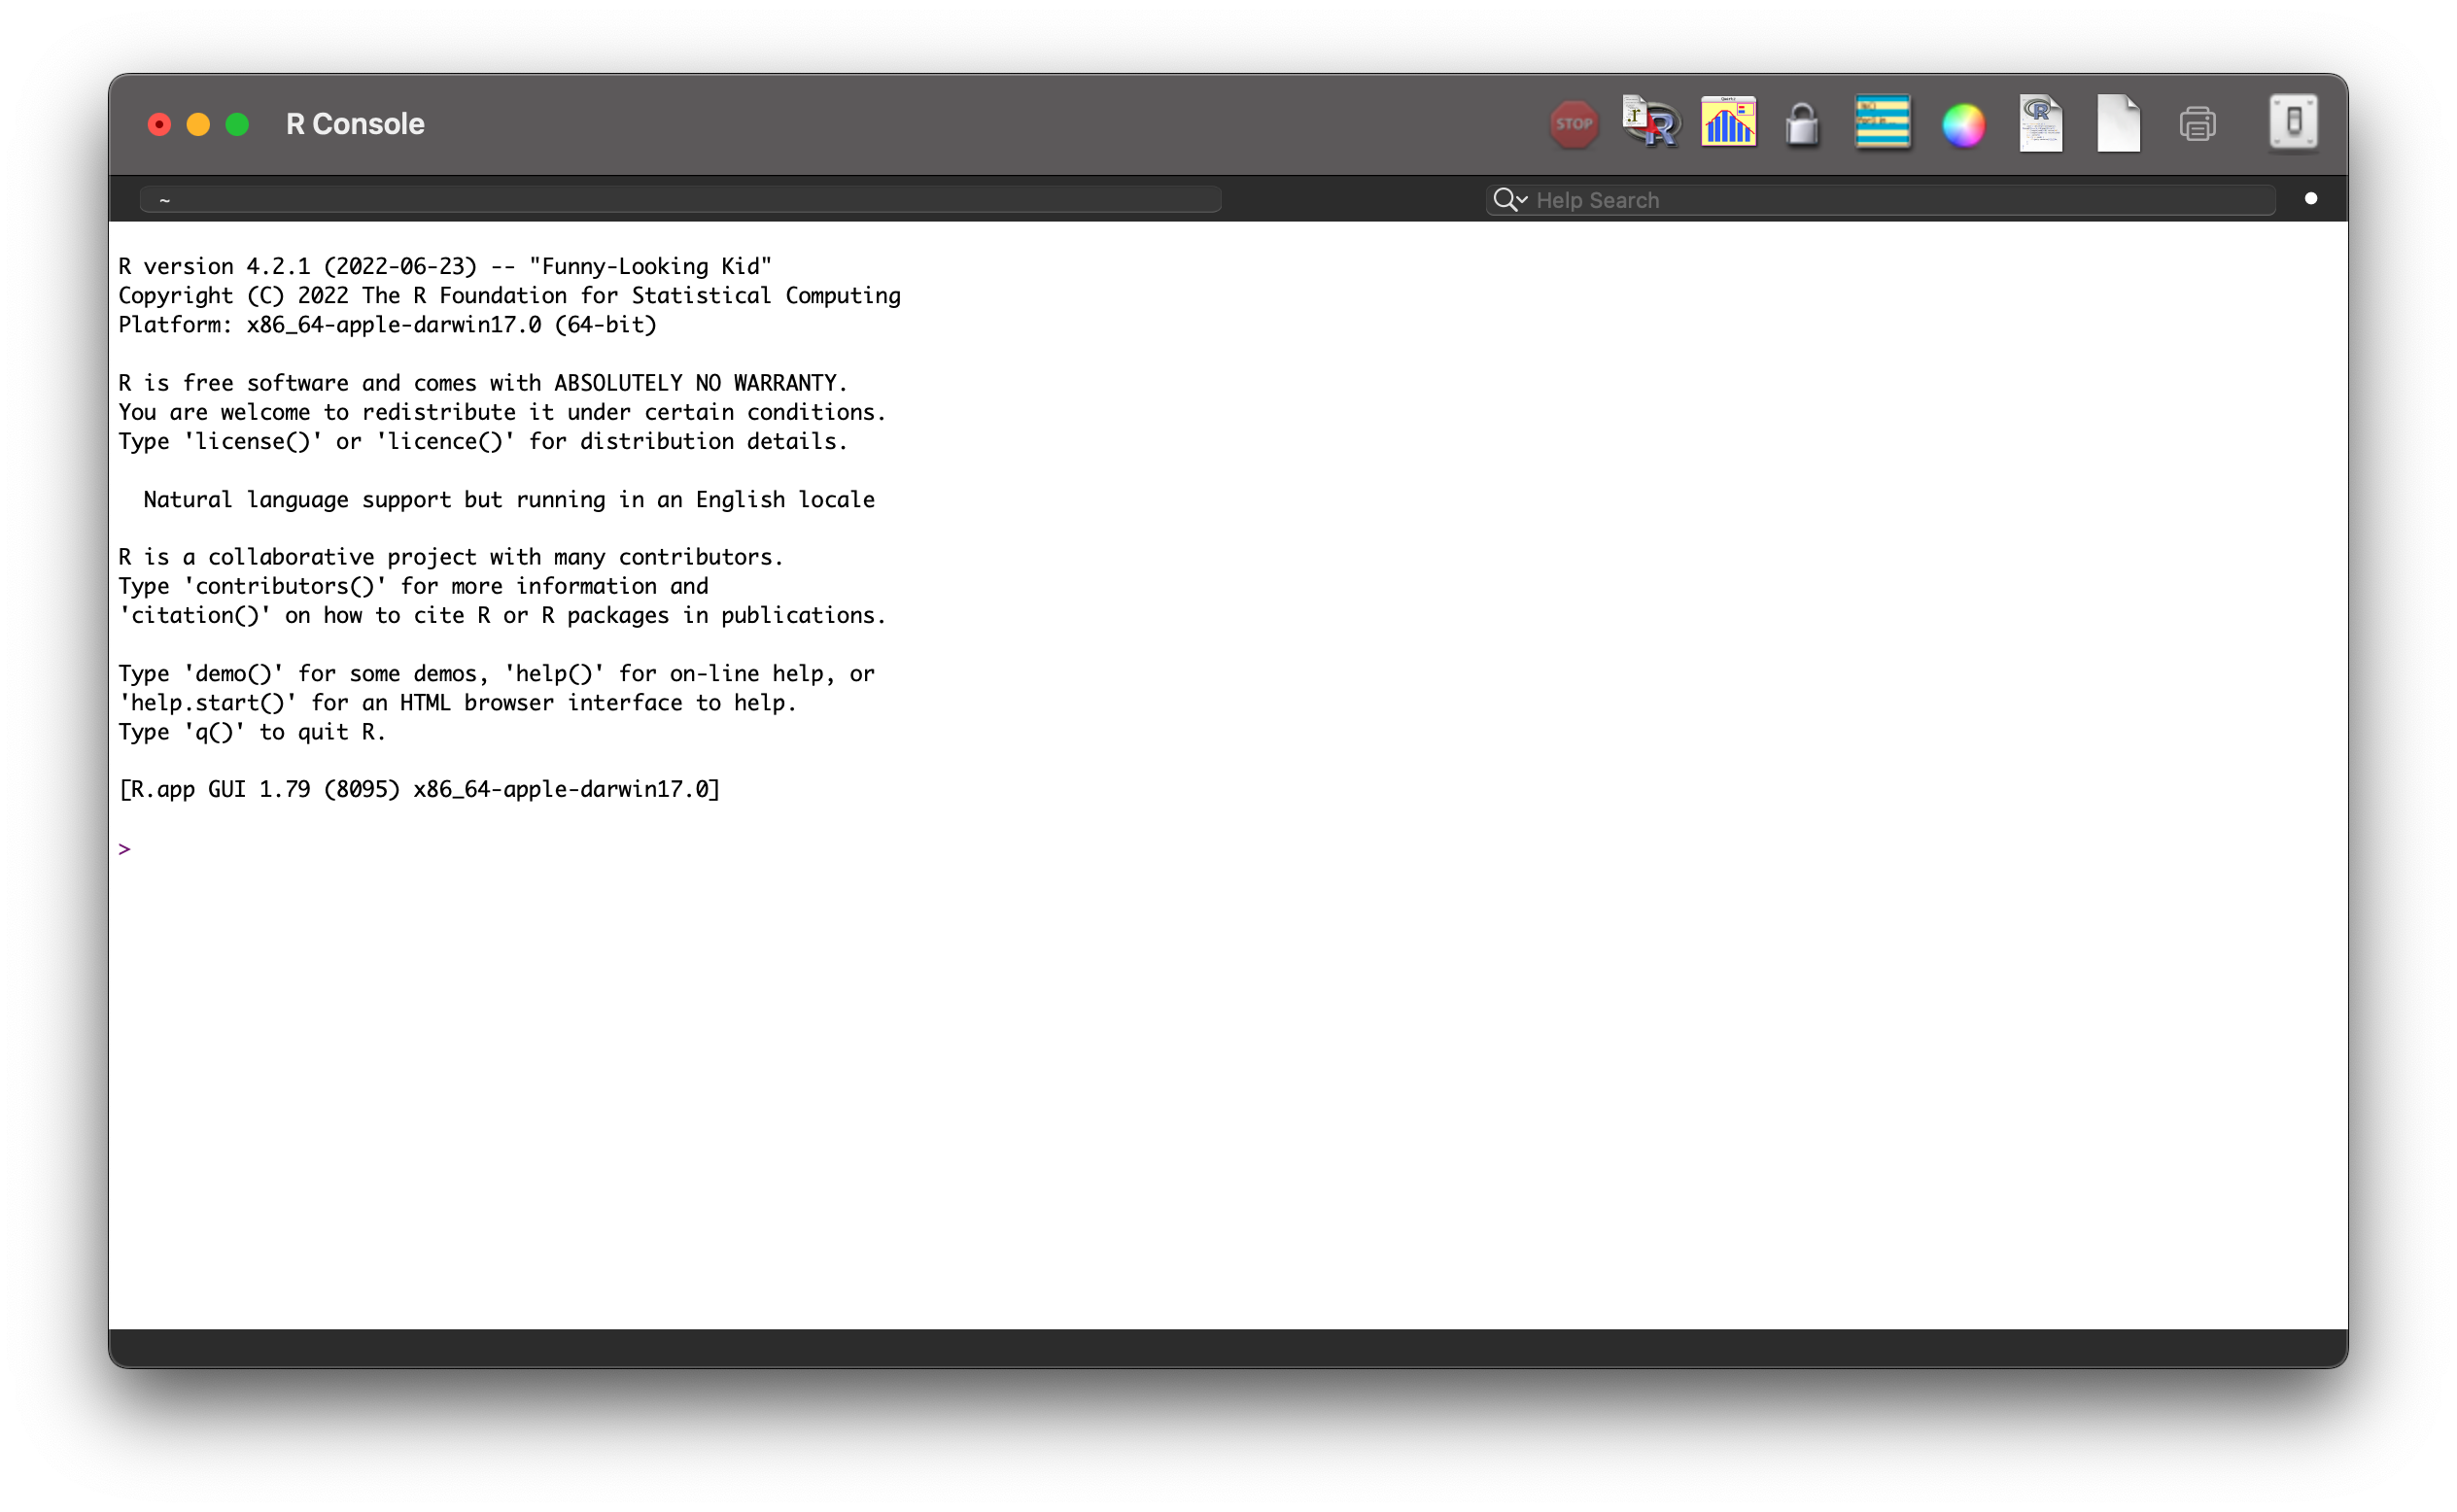
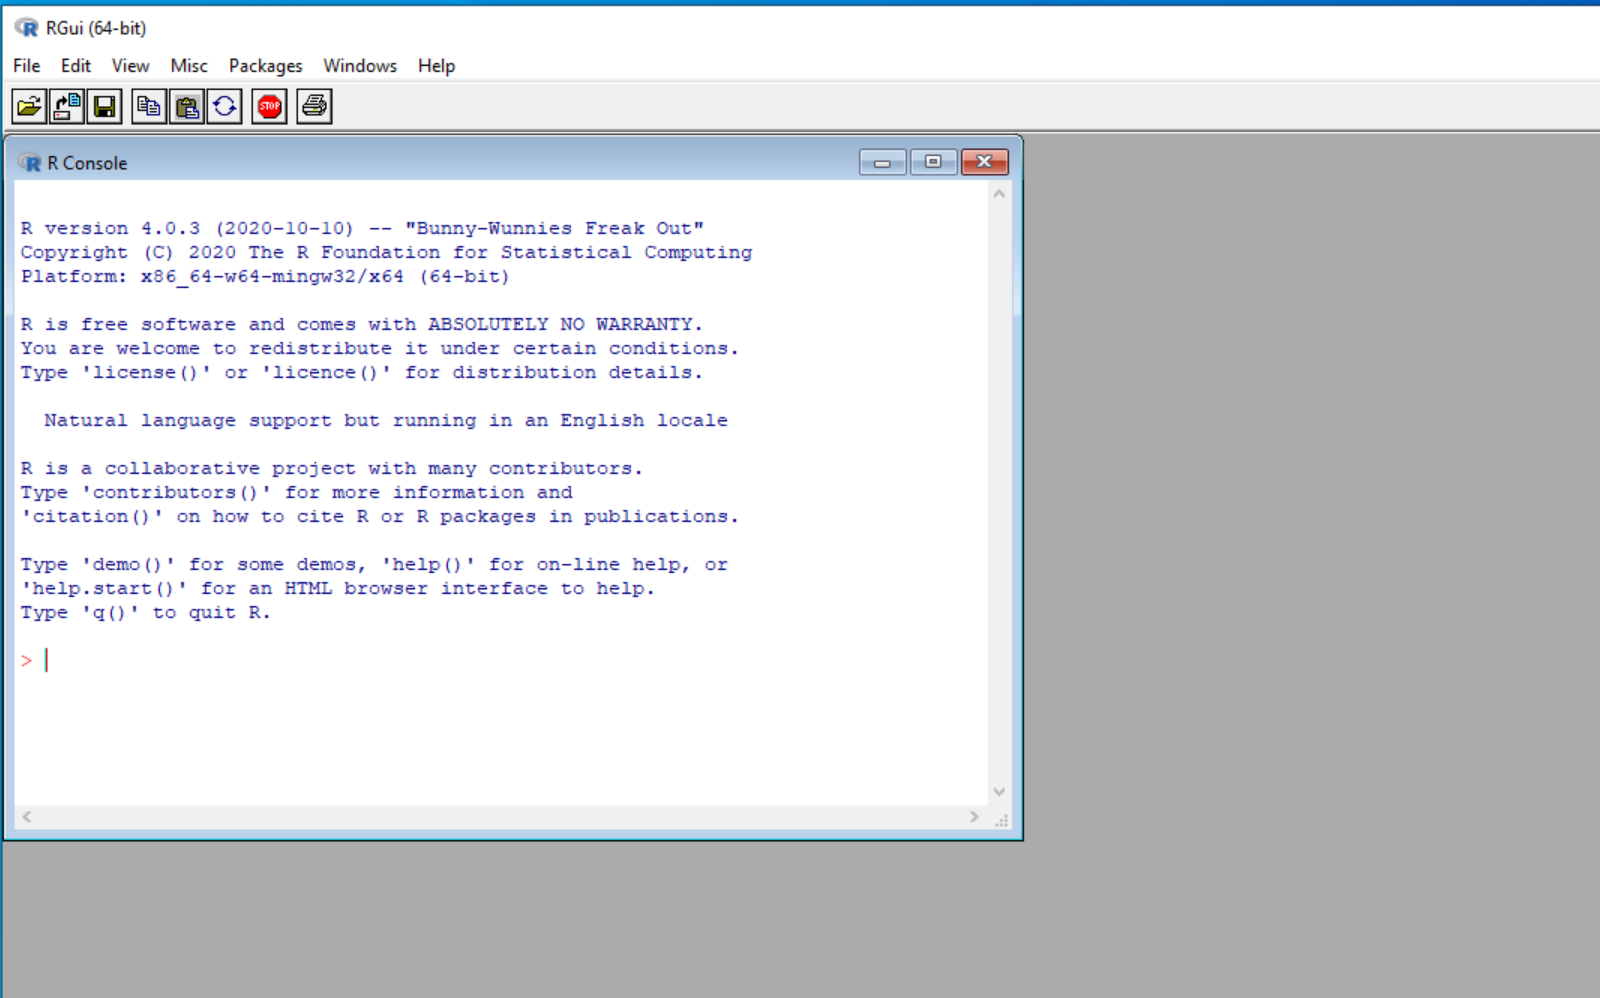
-
R works in the console as a "Read, Evaluate, Print Loop" (REPL). The
>symbol is a prompt; it is an indication that you're expected to type something. R will read what you type, evaluate it, and print the result. It will do this in a loop, i.e. repeatedly. -
For something very simple, let's just use R as a calculator. For example, type
at the prompt. R will read this expression, evaluate it, and print the result.6 * 7 -
R is designed to be used to do statistics. In statistics, we rarely, if ever, work
with a single value; we typically work with a collection of values. Because of this,
R supports data structures such as vectors and lists (we'll learn more about
these, and other similar ideas later) so that we can work with a collection of values.
The easiest way to create a vector of values is with the
c()(c stands for "combine") function. Enter the following:
This isn't very exciting: R simply reads the expression, evaluates it to a vector containing the five values, and prints those five values.c(2,3,5,7,8) -
However, since we have a collection of values, we could now do some statistics on them.
Try the following, to compute the mean (average) of those five values:
Pro-tip: If you want to modify a previous command, and run the modified version, use the up arrow to get to the previous command. You can then use the left and right arrows to edit that command, and press enter when it is the way you want it.
Congratulations: you just did your first statistics with R! Admittedly, this wasn't too exciting, but it's a start.mean( c(2,3,5,7,8) )
Installing RStudio
Using the console on its own is not very user friendly. Here, we'll install RStudio, which will make things easier going forward. Note we'll still be typing commands, but RStudio will give us lots of useful functionality for managing those commands.
- To download RStudio, navigate to https://rstudio.com/products/rstudio/download/
- Scroll down and press the "Download" button under the free "RStudio Desktop" version.
- You have already installed R, so under step 2, click on the "Download RStudio" for your operating system (which should be automatically detected).
- When the file has downloaded, open it and install RStudio.
- Open RStudio, which should now appear in the Start Menu (windows) or in LaunchPad or the Applications folder (Mac).
-
You should see a screen similar to this:
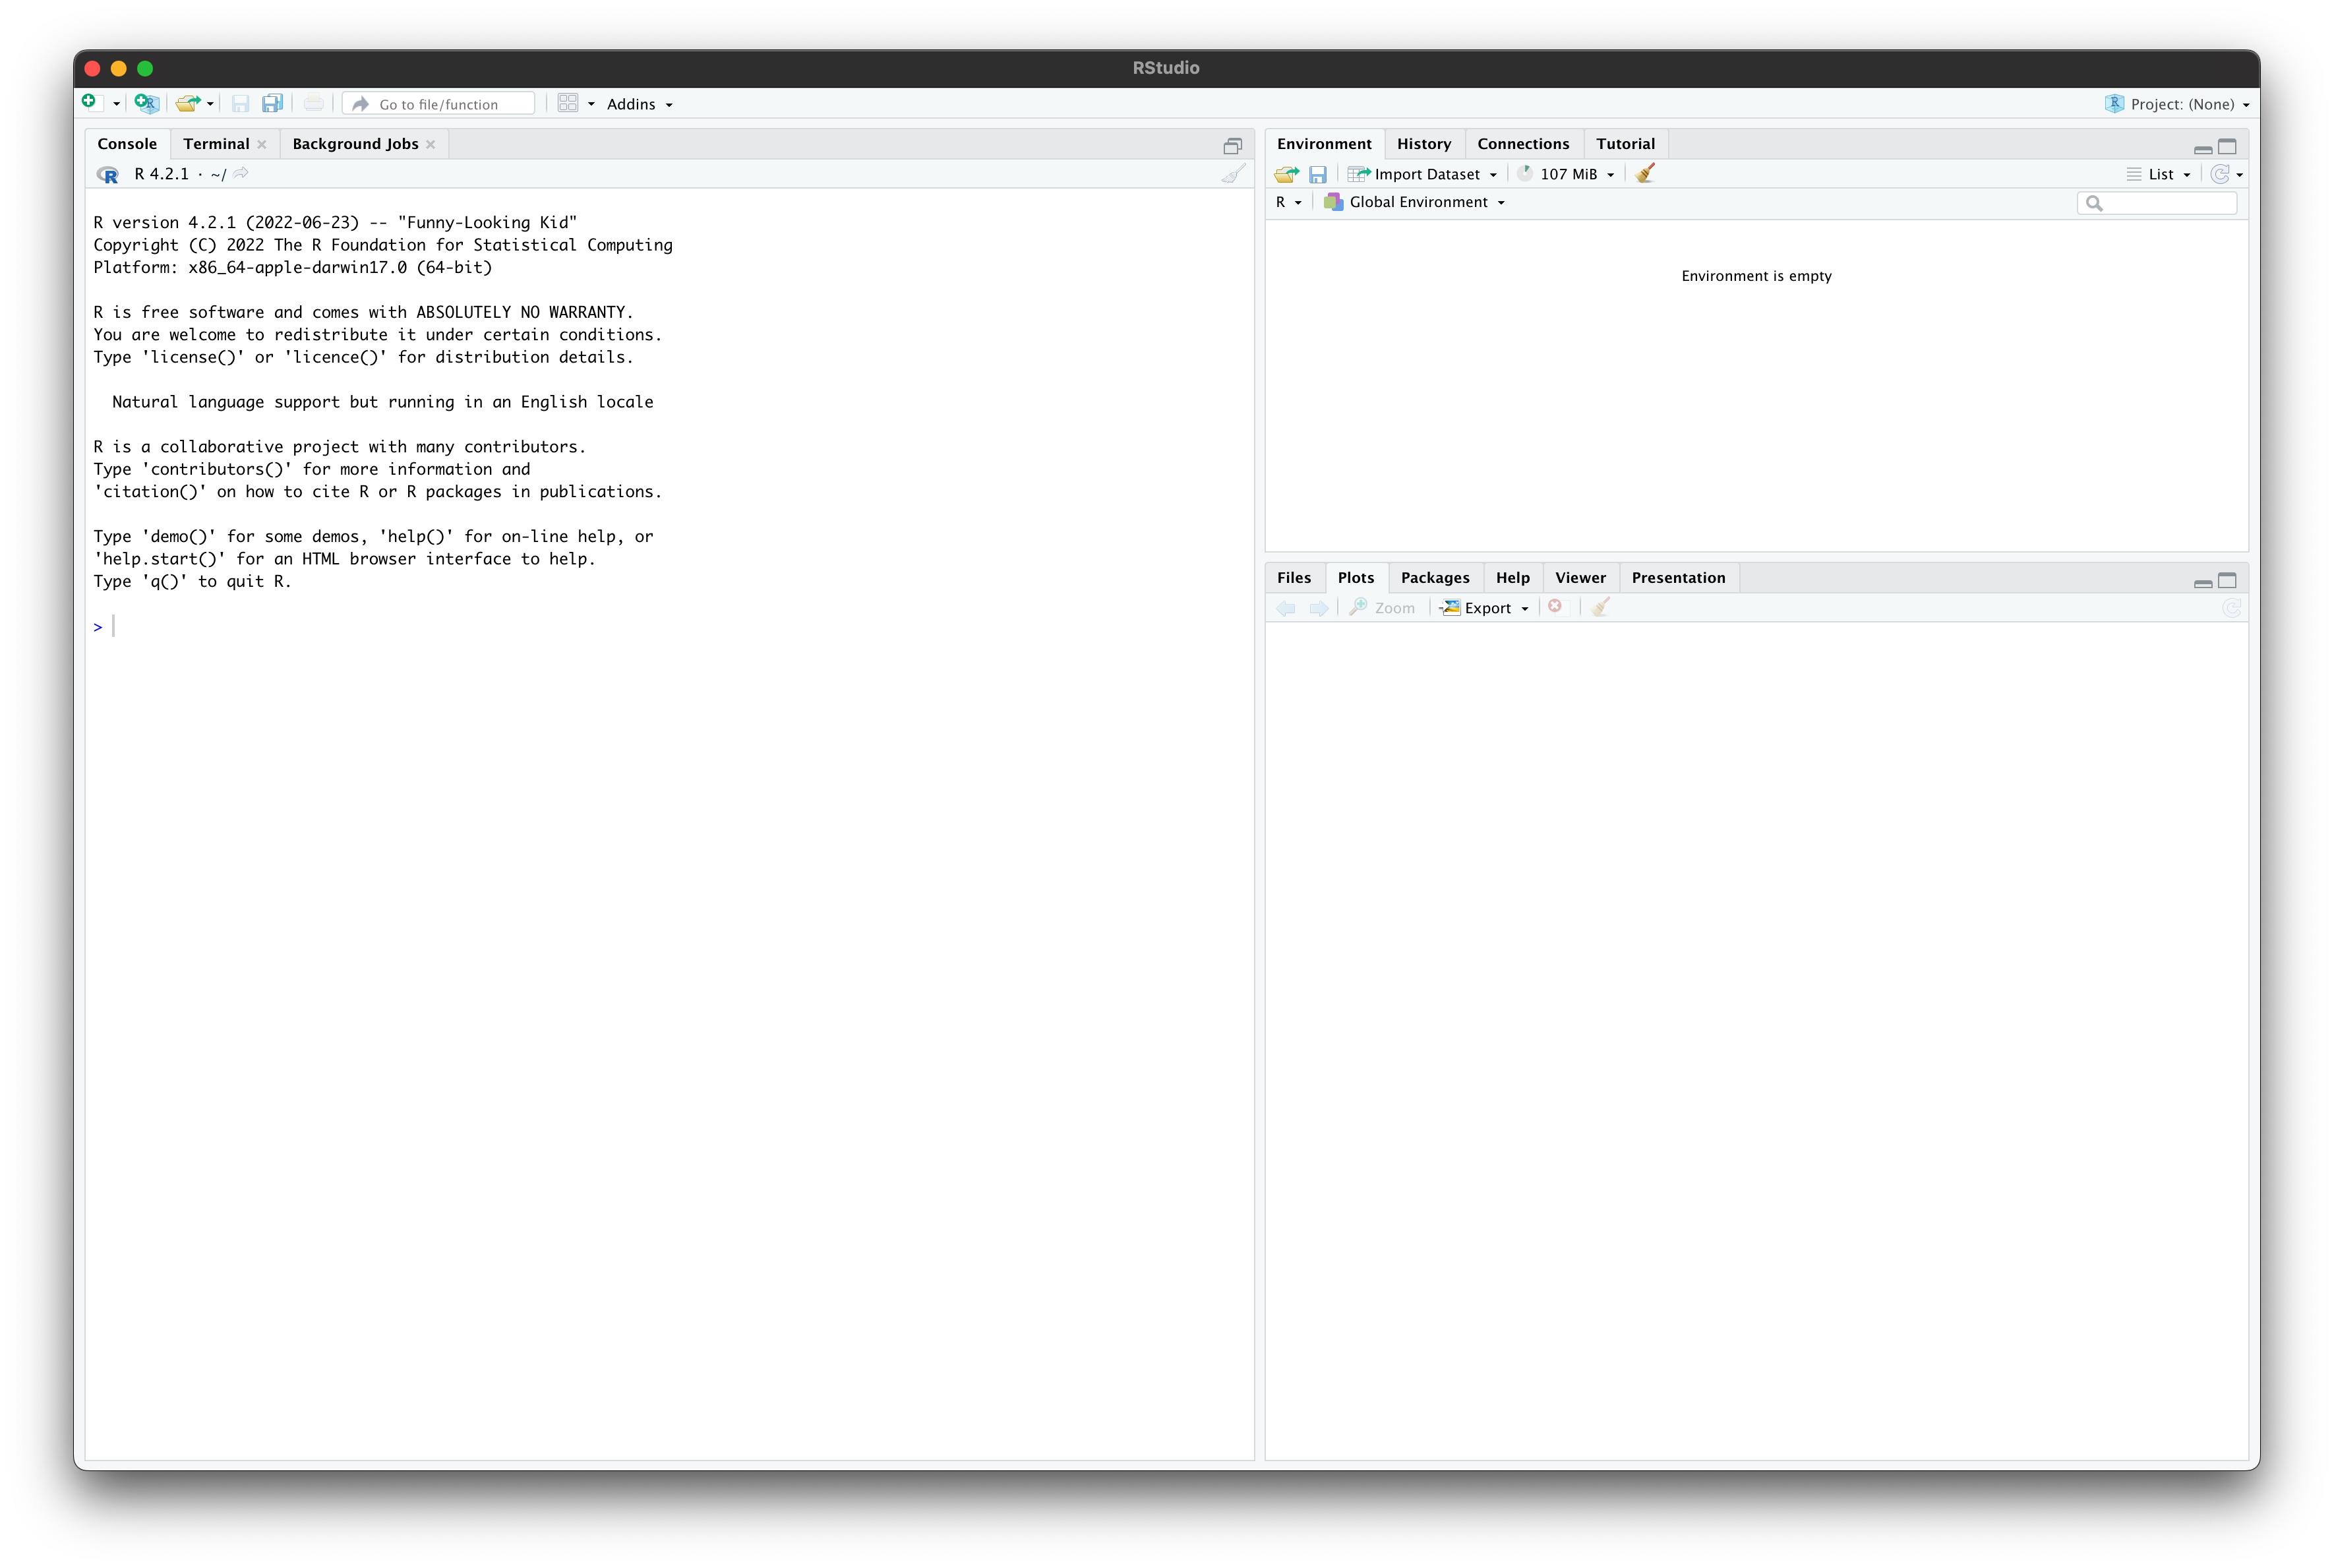
- In the "console" area on the left, we can do something similar to the work we did
before. Type
(The thing that looks like an arrow here is just a "less than sign",x <- c(2,3,5,7,8)<, followed by a minus sign,-).
This means, evaluatec(2,3,5,7,8)and save it in an object calledx. -
If you look in the "Environment" tab in the top right, you'll see that
xis displayed there, with its current value. -
You can find the average of the five values in
xusing themeanfunction:mean(x) - Try to find the standard deviation of the values in
x, using thesdfunction. -
Try the following:
boxplot(x)
Installing Packages
R supports the idea of packages, which are libraries of code designed to provide functionality beyond the base functionality of R. There are thousands of R libraries that have been written for many different fields of scientific research and data analysis.
To use a package, it must
- Installed once, and then
- Loaded for each session in which it's needed
We will install a package called tidyverse, which we'll use regularly throughout the course.
- In the RStudio menu, choose "Tools", and "Install Packages..."
- In the box labelled "Packages", type "tidyverse"
- Press "Install". You should see some output in the console.
To test the installation, try to load the library. You can do this by typing
library(tidyverse)
If it's successful, you should see output looking like
── Attaching packages ────────────────────────────────────────────────────────────────────────── tidyverse 1.3.2 ──
✔ ggplot2 3.3.6     ✔ purrr   0.3.4
✔ tibble  3.1.8     ✔ dplyr   1.0.9
✔ tidyr   1.2.0     ✔ stringr 1.4.0
✔ readr   2.1.2     ✔ forcats 0.5.1
── Conflicts ───────────────────────────────────────────────────────────────────────────── tidyverse_conflicts() ──
✖ dplyr::filter() masks stats::filter()
✖ dplyr::lag()    masks stats::lag()
If you've made it this far, you've successfully installed R and RStudio, done some very simple statistics with R, and created your first simple plot, as well as installing an R package. Next time, we'll learn a little bit more about how R works and start to explore some data.