BMR 617: Statistical Techniques for the Biomedical Sciences
Types of Variable
- This distinction is extremely important in deciding how to explore, analyze, and make inferences from your data.
- Asking the question "Are the explanatory and response variables categorical or quantitative?" goes a long way to determining the correct analysis to perform.
Types of Data
- Nominal
- Categorical, no ordering. Examples: Gender, Race, Genotype.
- Ordinal
- Categorical with an order. Examples: Socio-economic status, Pain scale
- Interval
- Numerical data on a scale (i.e. it has units) but no meaningful zero. Examples: temperature in Celcius or Fahrenheit. Time of day or date.
- Ratio
- Numerical data with scale and zero. Most measurement data is in this category.
Determining the type of the variable
- Is there an ordering for values of the variable?
- If there is an ordering, is there a scale?
- I.e., does an increase in one unit always mean the same thing?
- If there is an ordering and a scale, does the value zero have a specific meaning?
Nominal Variables
- Gender. Values might be "Female", "Male", "Other"
- Race. Values might be "African American", "Asian", "Caucasian", "Native American", etc.
Ordinal Variables
Ordinal variables are variables with qualitative categories which have an ordering, but no scale.
Example: Economic status.
- Values are typically stated as "Low", "Medium", or "High", which are computed using a number of factors (income, education level, occupation, wealth)
- These are ordered because there is a natural ordering low → medium → high.
- They have no scale because the difference between low and medium is not necessarily the same as the difference between medium and high.
Interval Variables
Interval variables are variables with ordering and scale, but with no meaningful zero.
Examples:
- Temperature in celsius or fahrenheit
- There is a scale,because a difference of one degree means the same thing, no matter what the starting temperature is
- However, the choice of a zero value (in either unit) is essentially arbitrary
- Time of day or date
Operations on Interval Variables
Computing differences of values of interval variables makes sense.
For example, computing a change in temperature (difference between two temperatures) makes sense, because a change of one unit (one degree) always means the same "amount of temperature".
Computing ratios of values of interval variables does not make sense, because there is no meaningful zero
- For example, it doesn't make sense to say that 100°C is double 50°C.
- In Farenheit, these values are 212°F and 132°F, respectively.
Ratio Variables
Ratio variables have both scale and a meaningful zero. Most measurements you work with will be ratio variables.
Examples: Length, mass, count data (e.g. number of cells), etc.
It makes sense to compute differences and ratios of ratio variables.
- A blood pressure of 120 is double the blood pressure of 60.
Note that the difference of values of an interval variable is always a ratio variable.
- E.g. age (the difference between two dates) is a ratio variable
Examples
| Variable | Type | |
|---|---|---|
| Tumor grade |
Nominal
Ordinal
Interval
Ratio
|
Incorrect
Tumors are graded Grade I through Grade IV, with Grade I being the most differentiated and
Grade IV being the least differentiated.
Incorrect
Tumors are graded Grade I through Grade IV, with Grade I being the most differentiated and
Grade IV being the least differentiated. Even though these are ordered, the "difference between grades"
is not really defined and there are no units. So these are not quantitative.
Correct
|
| Heart Rate |
Nominal
Ordinal
Interval
Ratio
|
Incorrect
Heart rate is a measurement, typically in units of beats/minute. It is quantitative.
Incorrect
A heart rate of zero has a specific meaning, and it makes sense to talk about doubling a heart rate.
Correct
|
| Color |
Nominal
Ordinal
Interval
Ratio
|
Incorrect
Colors do not have a specific order associated with them.
(Even if you think about color spectra, those are really circular.)
Incorrect
Colors are categorical,not quantitative.
Correct
|
| Weight (mass) |
Nominal
Ordinal
Interval
Ratio
|
Incorrect
Mass is a measurement and is quantitative.
Incorrect
A zero mass has a specific meaning (there is no matter there)
and it makes sense to talk about doubling the mass of something.
Correct
|
| Disease status |
Nominal
Ordinal
Interval
Ratio
|
Incorrect
Disease status is typically "Diseased" or "Not diseased".
This do not have an ordering associated with them.
Incorrect
Disease status is typically "Diseased" or "Not diseased".
This is categorical, not quantitative.
Correct
|
| Pain scale |
Nominal
Ordinal
Interval
Ratio
|
Incorrect
Typically, hospital admissions ask for a pain rating on a scale of 1-10.
These have an ordering to them, so they are not nominal.
Incorrect
Even though pain scales are ordered, there are no real units, and there's
no real sense in which the difference between, for example, a pain rating of 2 and of 3
is the "same as" the difference between a pain rating of 9 and of 10. These
are really just 10 arbitrary categories in an order.
Correct
Even though pain scales are ordered, there are no real units, and there's
no real sense in which the difference between, for example, a pain rating of 2 and of 3
is the "same as" the difference between a pain rating of 9 and of 10. These
are really just 10 arbitrary categories in an order.
|
| Age |
Nominal
Ordinal
Interval
Ratio
|
Incorrect
Age is a quantitative measure of time (typically in years, but it could
just as well be measured in seconds, or any other time unit).
Incorrect
Age is quantitative, and zero has a specific meaning. Age is a measure of time.
Correct
|
| Genotype |
Nominal
Ordinal
Interval
Ratio
|
Incorrect
Genotype is categorical (for example, if the possible alleles are C and T, the values are CC, CT, TT),
but there is no sense of ordering of these values.
Incorrect
Genotype is categorical (for example, if the possible alleles are C and T, the values are CC, CT, TT).
Correct
|
| CT values from RT-PCR |
Nominal
Ordinal
Interval
Ratio
|
Incorrect
CT values are quantitative. They represent the (interpolated) number of cycles
on a thermocycler to reach some threshold quantity of DNA.
Correct
CT values are definitely quantitative. It is somewhat debatable whether a CT
of zero has a specific meaning.
|
Categorical and Quantitative Variables
Nominal and Ordinal variables are categorical. They take on specific values only.
Interval and ratio variables are quantitative. They measure some value.
When we come to visualize and analyze data, the distinction between categorical and quantitative variables is the most important one. Knowing which variables are categorical and which are quantitative goes a long way to determining the correct presentation and analysis of the data.
Types of variable in R
R supports the notion of types of variable
Open Rstudio and type the following in the console (don't worry about what these functions mean yet):
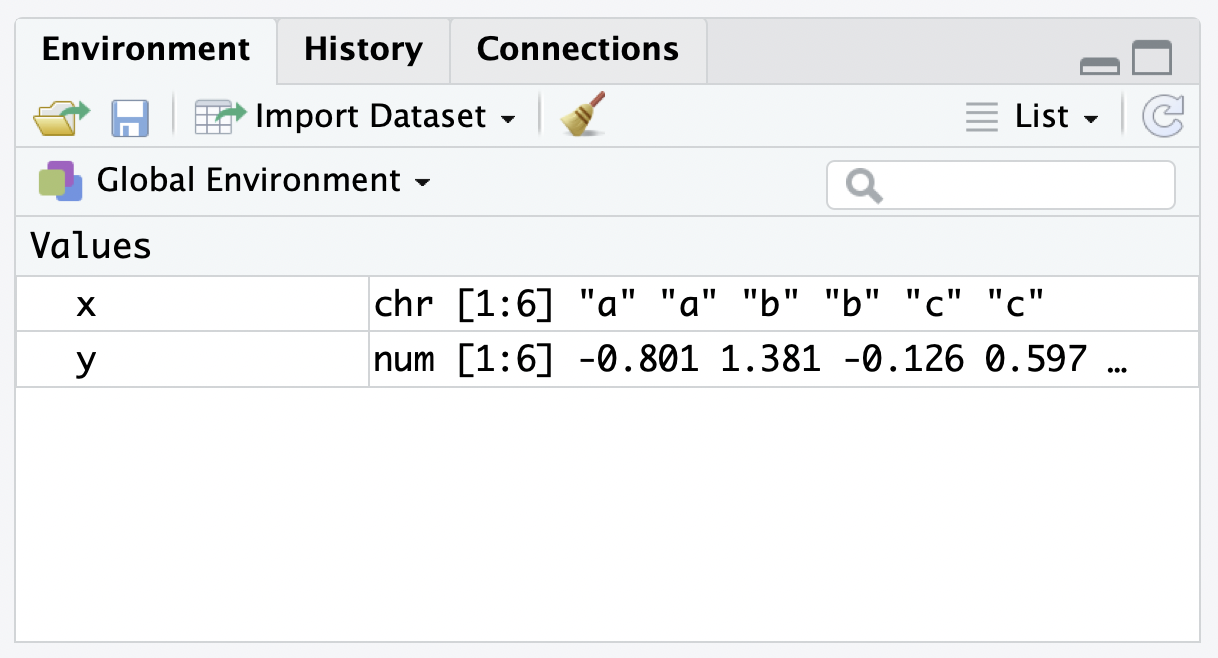
 	x <- rep(c("a", "b", "c"),  each=2)
 	y <- rnorm(6)
Look in the environment tab? What is the value of x? Can you guess
what the function rep means?
What is the value of y?
rnormgives random values from the normal distribution.
In R, we can ask what type a variable is using the class function.
Try the following:
 	class(x)
 	class(y)
Look in the "Environment" tab. Can you interpret everything that's displayed there?
Variable Types
Thinking in statistical terms, are x and y
categorical or quantitative?
So in R, a character variable is , and a numeric variable is .
Example
Imagine a genetic study of obesity, in which we want to determine if the genotype of a particular locus confers obesity.
We could recruit a cohort of patients, measure their BMI, categorize them as obese (yes or no), and determine their genotype at a the locus of interest.
- Let’s assume the locus of interest has two possible alleles, C and T
| Variable | Categorical or Quantitative | |
|---|---|---|
| BMI |
Categorical
Quantitative
|
Incorrect
BMI is a measure; it's a person's weight divided by the square of their height.
Correct
BMI is a measure; it's a person's weight divided by the square of their height.
|
| Obese |
Categorical
Quantitative
|
Incorrect
"Obese" takes on the specific values "yes" or "no", so it's categorical.
Correct
"Obese" takes on the specific values "yes" or "no", so it's categorical.
|
| Genotype |
Categorical
Quantitative
|
Incorrect
"Genotype" takes on the specific values "CC", "CT", or "TT".
Correct
"Genotype" takes on the specific values "CC", "CT", or "TT".
|
Factors in R
In R, we could represent our genotype variable with a character. Try:
gt <- c("CC", "CC", "CT", "TT", "CT", "CC")
Look in the environment. What is the type of gt? Is this what you expect?
What does the following give?
gt[[3]]
What happens if you do
gt[[2]] <- "CT"
What about
gt[[2]] <- "Meaningless"
When we have a variable that can only take on a fixed set of values, it’s useful to force R to only let it have those values.
- This is a common feature of many categorical variables.
In R, a factor gives this functionality.
Try the following:
gt <- factor(c("CC","CC","CT","TT","CT","CC"))
What does the environment tab display for gt now?
What if you display it in the console? (Just type gt in the console.)
Missing values and incorrect values in factors
Many times when working with data, some values are missing.
- Particularly true for clinical and patient/subject-based studies.
R reserves the special value NA to represent a missing value.
Now we have gt as a factor, what happens if you do
	gt[[2]] <- “nonsense”
	gt
Using a factor in R allows us to force all values to either be meaningful, or missing.
Summary
There are four types of variable:
- Nominal
- Ordinal
- Interval
- Ratio
Nominal and ordinal variables are categorical.
Interval and ratio variables are quantitative.
The distinction between categorical and quantitative drives the decision as to how to visualize and analyze data.
Summary of R work
In R, we have learned:
- The
<-combination of symbols assigns a value to a variable.- Note you can also use
=here:x=c(2,3,5,7,8), but I prefer<-
- Note you can also use
- You can access individual elements of a variable using
[[ ]]x[[3]]will give the third element ofx.
x[[2]] <- 5will change the second element ofxto5.- You can find the type of a variable
xusingclass(x) - Use character and factor types for categorical variables, numeric for
quantitative variables
- We’ll see other types during the course
- The special value NA represents a missing value.